What Are Tick Charts?
Tick charts are different from traditional time-based charts in a significant way. Rather than creating bars based on a set time interval, tick charts generate bars after a specified number of trades, known as ticks and About Webull
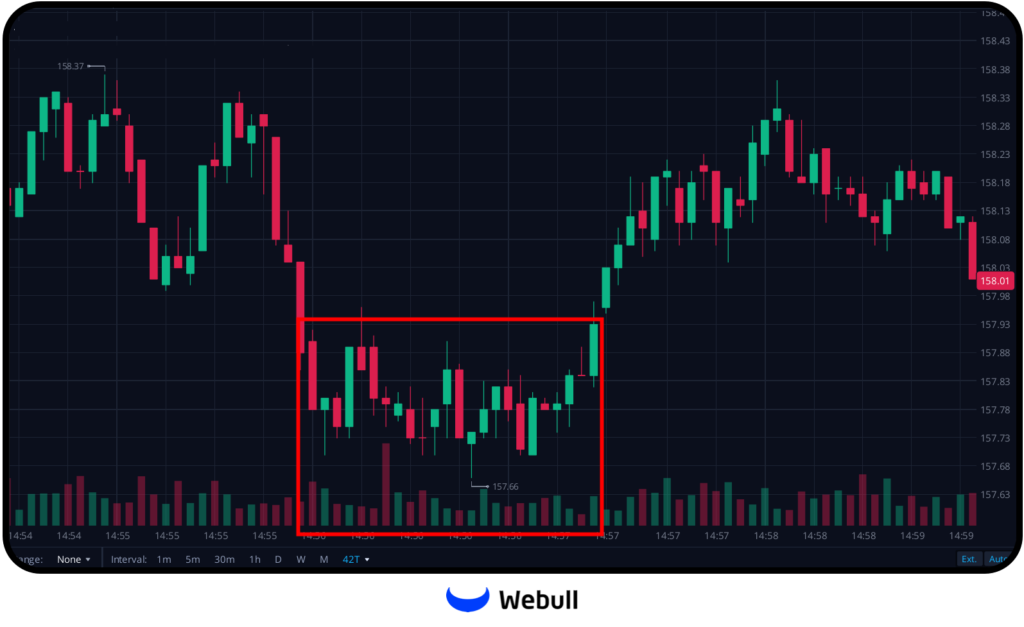
For example, a 42-tick chart will create a new bar after every 42 trades, regardless of how long that takes. This allows traders to see price action that is directly tied to market activity, instead of just time passing.
Tick charts help remove noise from the market during slow periods. In time-based charts, low trading activity can produce many bars without much useful information. But with tick charts, the focus is on actual trade execution.

Key Benefits of Using Tick Charts
The following are the key benefits that you can experience:
- Capture Market Activity in Real-Time:
Tick charts show market movement based on trades, not by minutes or seconds passing.
- Remove Time-Based Noise:
Time-based charts display excessive noise during low activity. Tick charts provide clearer trade data, especially in quiet markets.
- Improve Scalping and Day Trading:
Tick charts give day traders and scalpers a closer look at fast-moving markets. More detail can lead to more informed decisions.
- Adapt to Market Volatility:
Tick charts respond dynamically to periods of high and low market activity. During volatile periods, you’ll see more frequent updates. When the market slows down, fewer bars are created, but they’re more meaningful.
- Better Price Action Insights:
Day traders rely on price action to make decisions. Tick charts give a more granular view of price movements, allowing for better timing on trade entries and exits.

How to Use Tick Charts on Webull: Set Up Process
Webull offers advanced charting tools, and tick charts are one of the most useful for short-term traders. However, these charts are only available on the Webull desktop version. Follow these steps to know how to use tick charts on Webull:
Step 1: Open the Webull Desktop App
Before anything, download and install the Webull desktop app if you haven’t already. Once installed, log into your account.
Step 2: Access the Chart Settings
Once logged in, navigate to the charting section. Here, you can customize your charts by right-clicking on the chart you want to modify. Click on the settings icon to access chart options.
Step 3: Select Tick as Your Time Interval
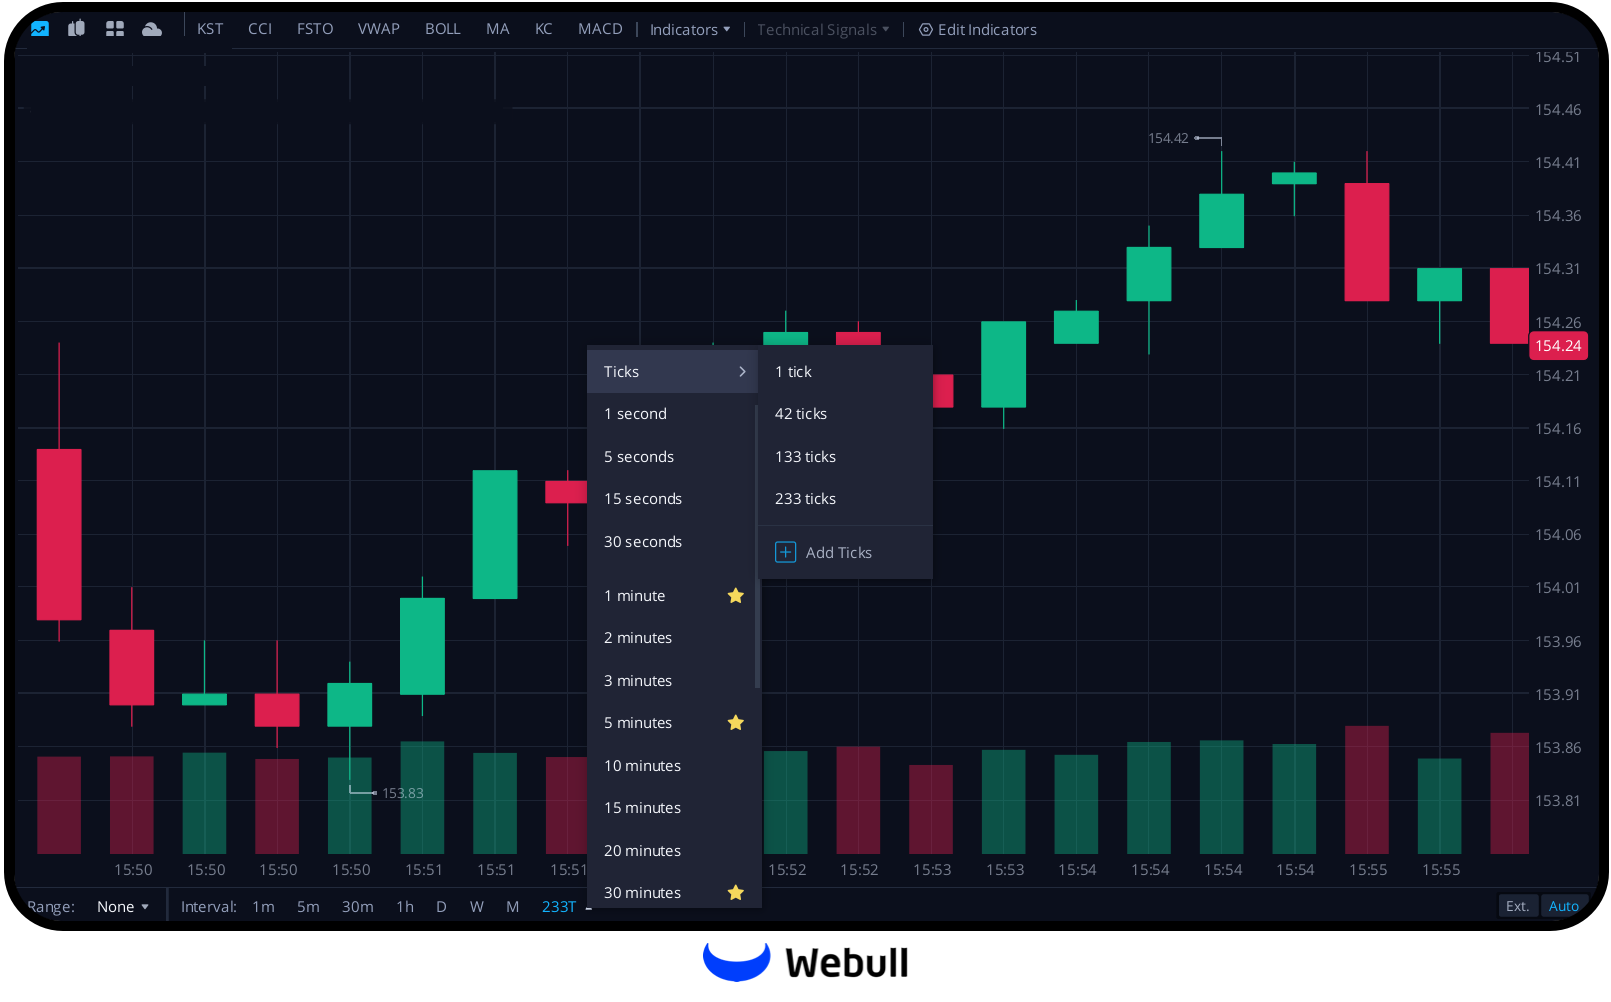
In the chart settings, you’ll see various time intervals to choose from, such as 1 minute, 5 minutes, or 1 hour. To switch to tick charts, look for the option to select Tick as the interval. You can then select a specific tick number, such as 42 ticks or 233 ticks, depending on your preference.
Step 4: Customize the Number of Ticks
One of the advantages of Webull’s tick charts is the ability to customize them based on your strategy. Webull allows you to set tick counts anywhere between 1 and 999 ticks. For example, if you are a scalper looking to capture micro price movements, you may want to set a lower tick count, like 10 or 50 ticks.
On the other hand, if you are a day trader looking for slightly longer trends, you may want to opt for higher tick counts, such as 100 to 300 ticks.
Step 5: Analyze the Market Movements
Once you’ve set up the tick chart, start observing the market activity based on the number of trades occurring. As more trades are executed, the chart will form new bars, providing a real-time, detailed view of price movements.
How Tick Charts Differ from Traditional Time-Based Charts
Tick charts and time-based charts provide different types of information, each useful in specific market conditions.
- Flexibility in Volatile Markets
Time-based charts can give skewed data during periods of low trading activity. This can result in more noise, making it harder to identify meaningful price trends. Tick charts, however, provide more precise data, especially when there are bursts of trading activity.
During periods of high volatility, tick charts generate more bars, allowing traders to see every small price movement. Conversely, during quieter times, fewer bars will appear, but they will be more meaningful since they represent actual trades.
- Reduced Market Noise
In time-based charts, a new bar forms regardless of how many trades have taken place within that period. This can lead to charts filled with excessive noise, especially when there is little market activity. Tick charts smooth out this noise by only forming bars based on the number of trades executed.
- More Accurate View of Price Action
Since tick charts are based on trades, not time, they provide a more accurate view of price action. This helps traders spot price trends or reversals more quickly.
Does Webull Trade Using Ticks?
A common question among traders is: Does Webull trade using ticks? The short answer is no. Webull does not allow direct trading based on tick-by-tick data. However, Webull provides tick charts as a powerful visual tool to aid traders in making more informed decisions.
While you can’t trade directly using tick data on Webull, these charts help you track market activity more effectively. Webull still supports traditional order types like market, limit, and stop orders. Tick charts serve as a supplemental tool that helps day traders and scalpers analyse the market more closely.
How to Use Ticks on Webull for Effective Trading
To understand how to use ticks on Webull for effective trading, follow the following steps:
- Identify Volatile Trading Periods
Tick charts work best during periods of high trading activity. If you’re a day trader or scalper, use tick charts to identify periods of increased volatility. These periods often present the best opportunities for quick trades.
- Use Lower Tick Counts for Scalping
Scalping requires quick decision-making. Lower tick counts, such as 10 to 50 ticks, show frequent bars and provide a clearer view of short-term price movements. By focusing on smaller price changes, you can find better entry and exit points.
- Combine Tick Charts with Technical Indicators
Tick charts become even more powerful when combined with other technical indicators. For example, you can add moving averages, Bollinger Bands, or RSI to your tick chart to confirm trade signals. These indicators can help you spot trends, overbought or oversold conditions, and potential reversals.
- Avoid Overtrading
While tick charts provide more detailed information, they can also tempt traders to overtrade. The frequent bar formations may make it seem like there are endless opportunities to enter and exit the market. However, it’s important to stick to your trading strategy and not let the constant updates drive impulsive trading decisions.
The Bottom Line
Tick charts on Webull offer a unique way to analyse market activity. Unlike traditional time-based charts, tick charts focus on the number of trades executed, providing clearer insights during volatile periods.
While you can’t directly trade based on tick data, using tick charts can improve your trading strategy. They provide a more accurate view of price movements, helping day traders and scalpers make better trading decisions.
By learning tick charts, you can reduce noise, capture short-term price movements, and improve your overall trading success.


